Category:
Web & Mobile Application Design
Client:
Pietro Fiorentini
Duration:
4 weeks
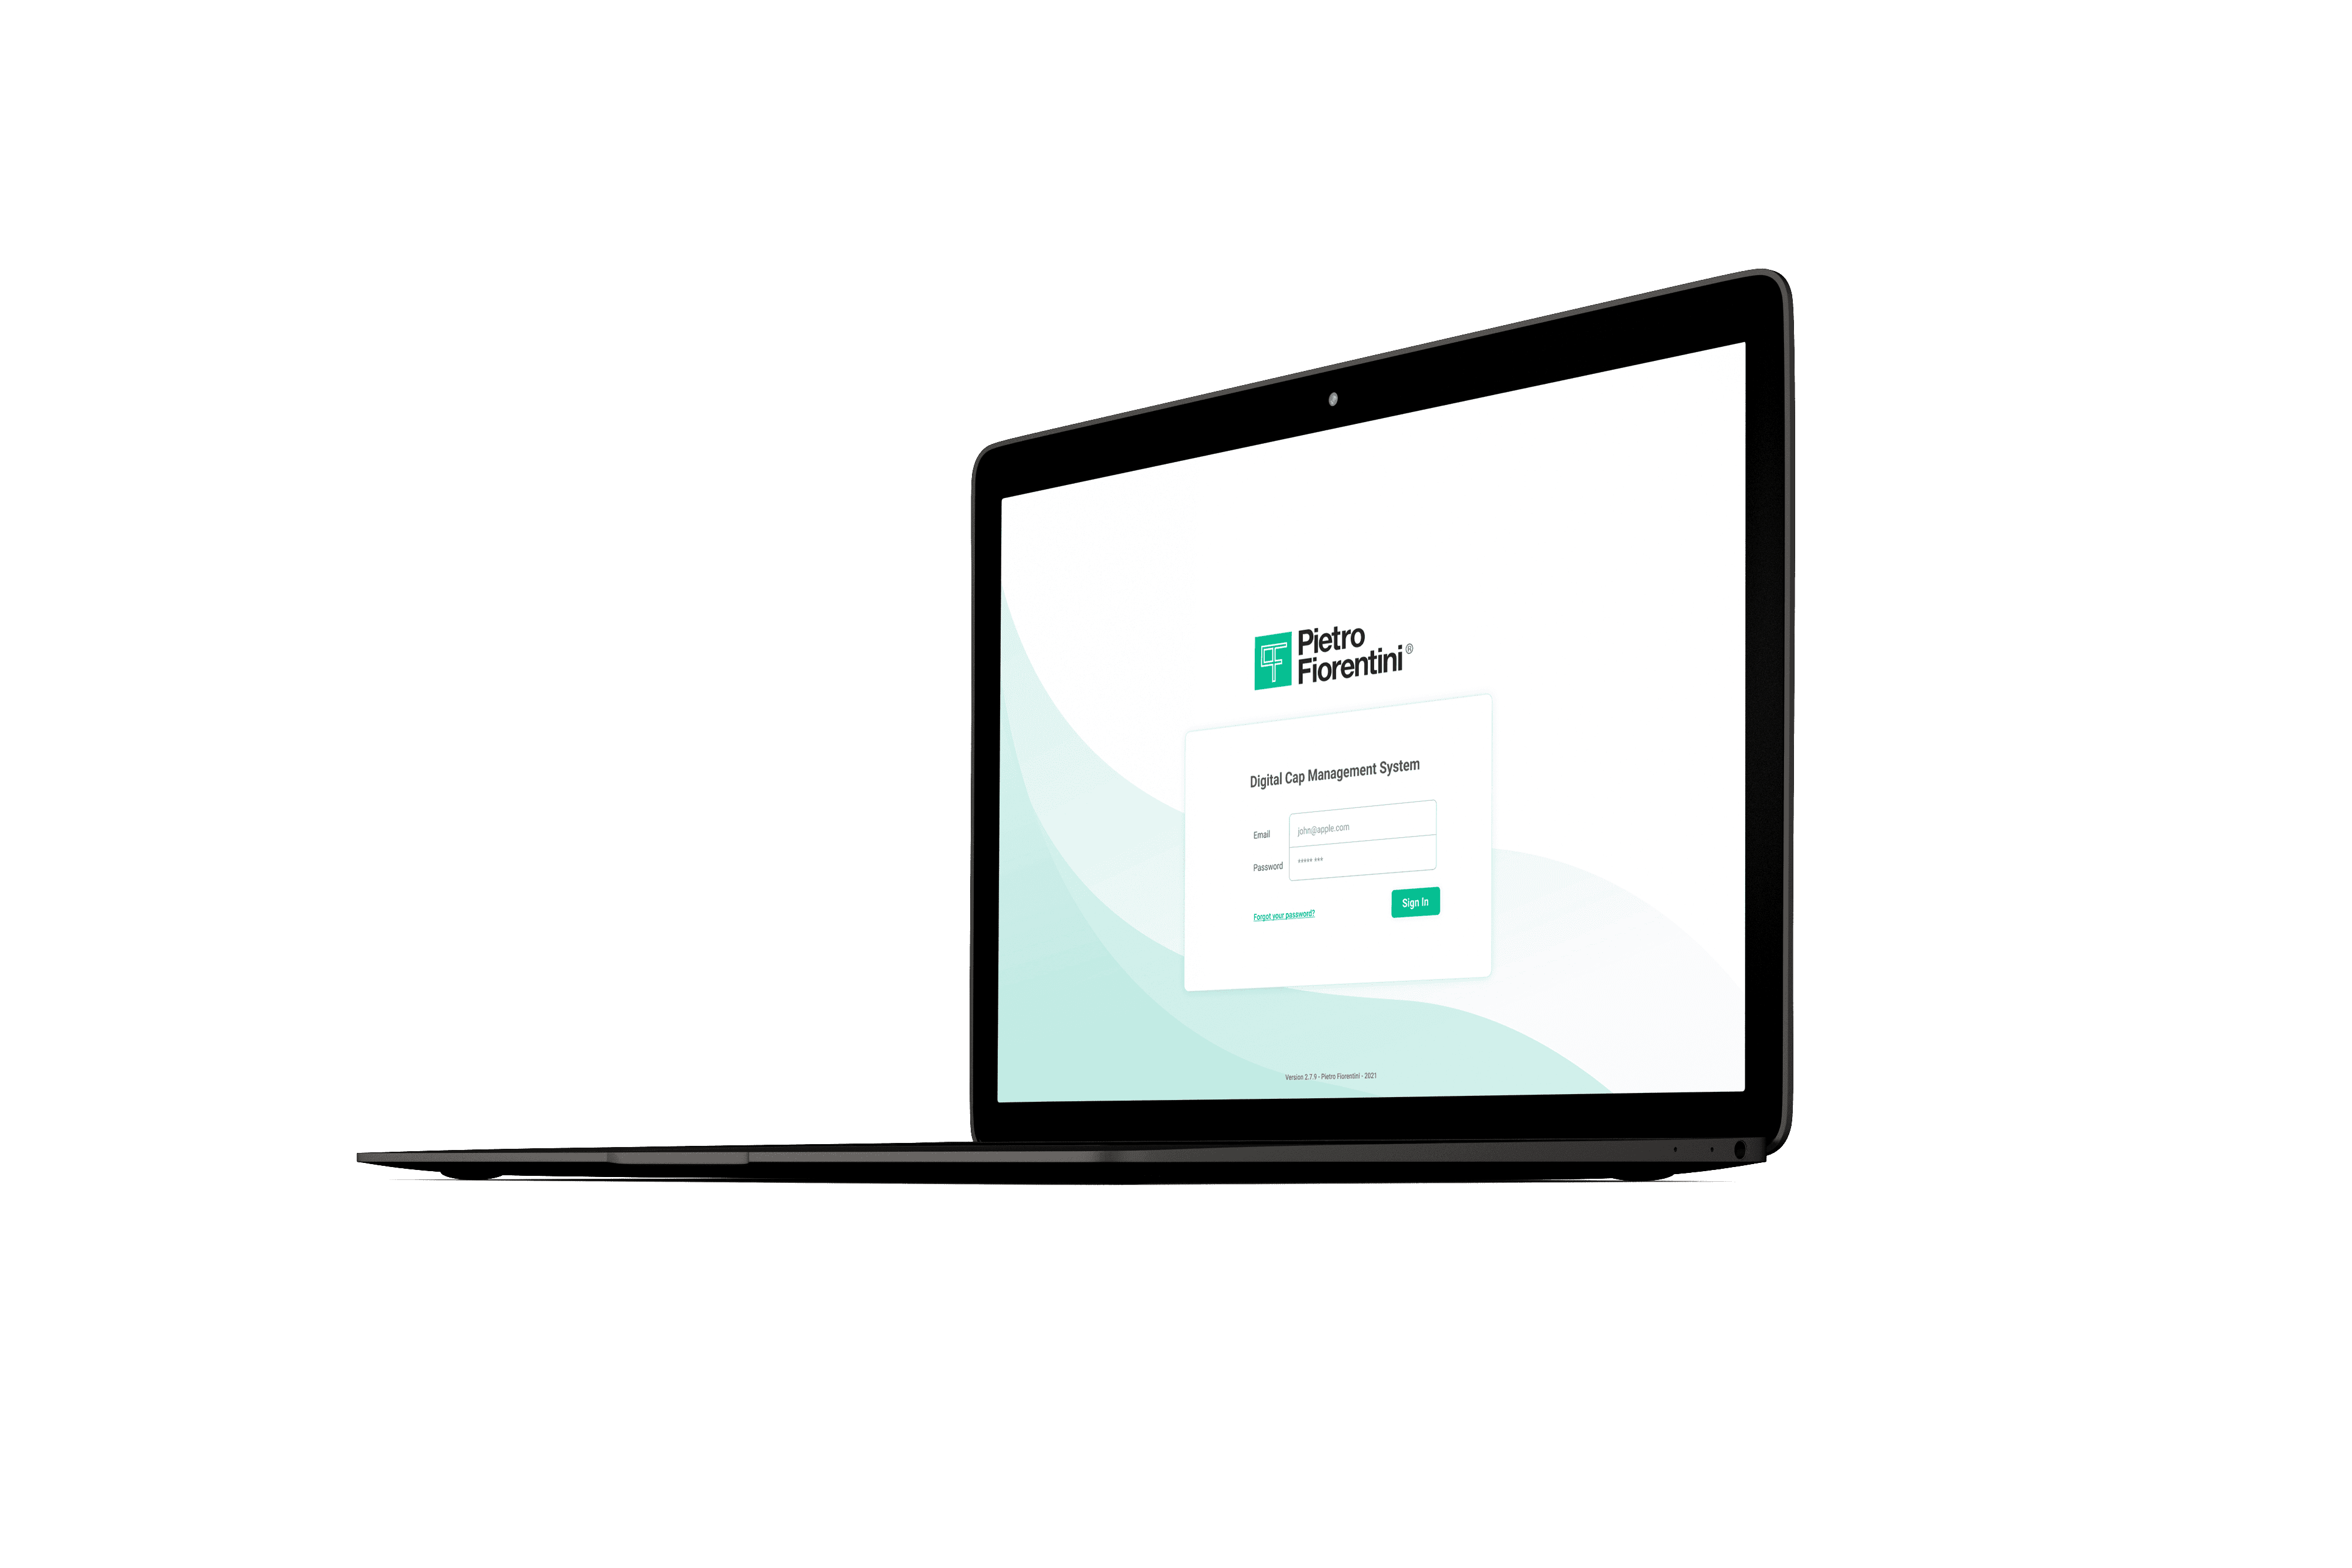
Pietro Fiorentini is a company with expertise in developing advanced solutions for the natural gas sector. They specialize in manufacturing a wide range of products, including smart gas metering devices with management systems. My role was focused on creating responsive user-centric designs that established the functionality and accessibility of their smart gas metering solution.
PROBLEM
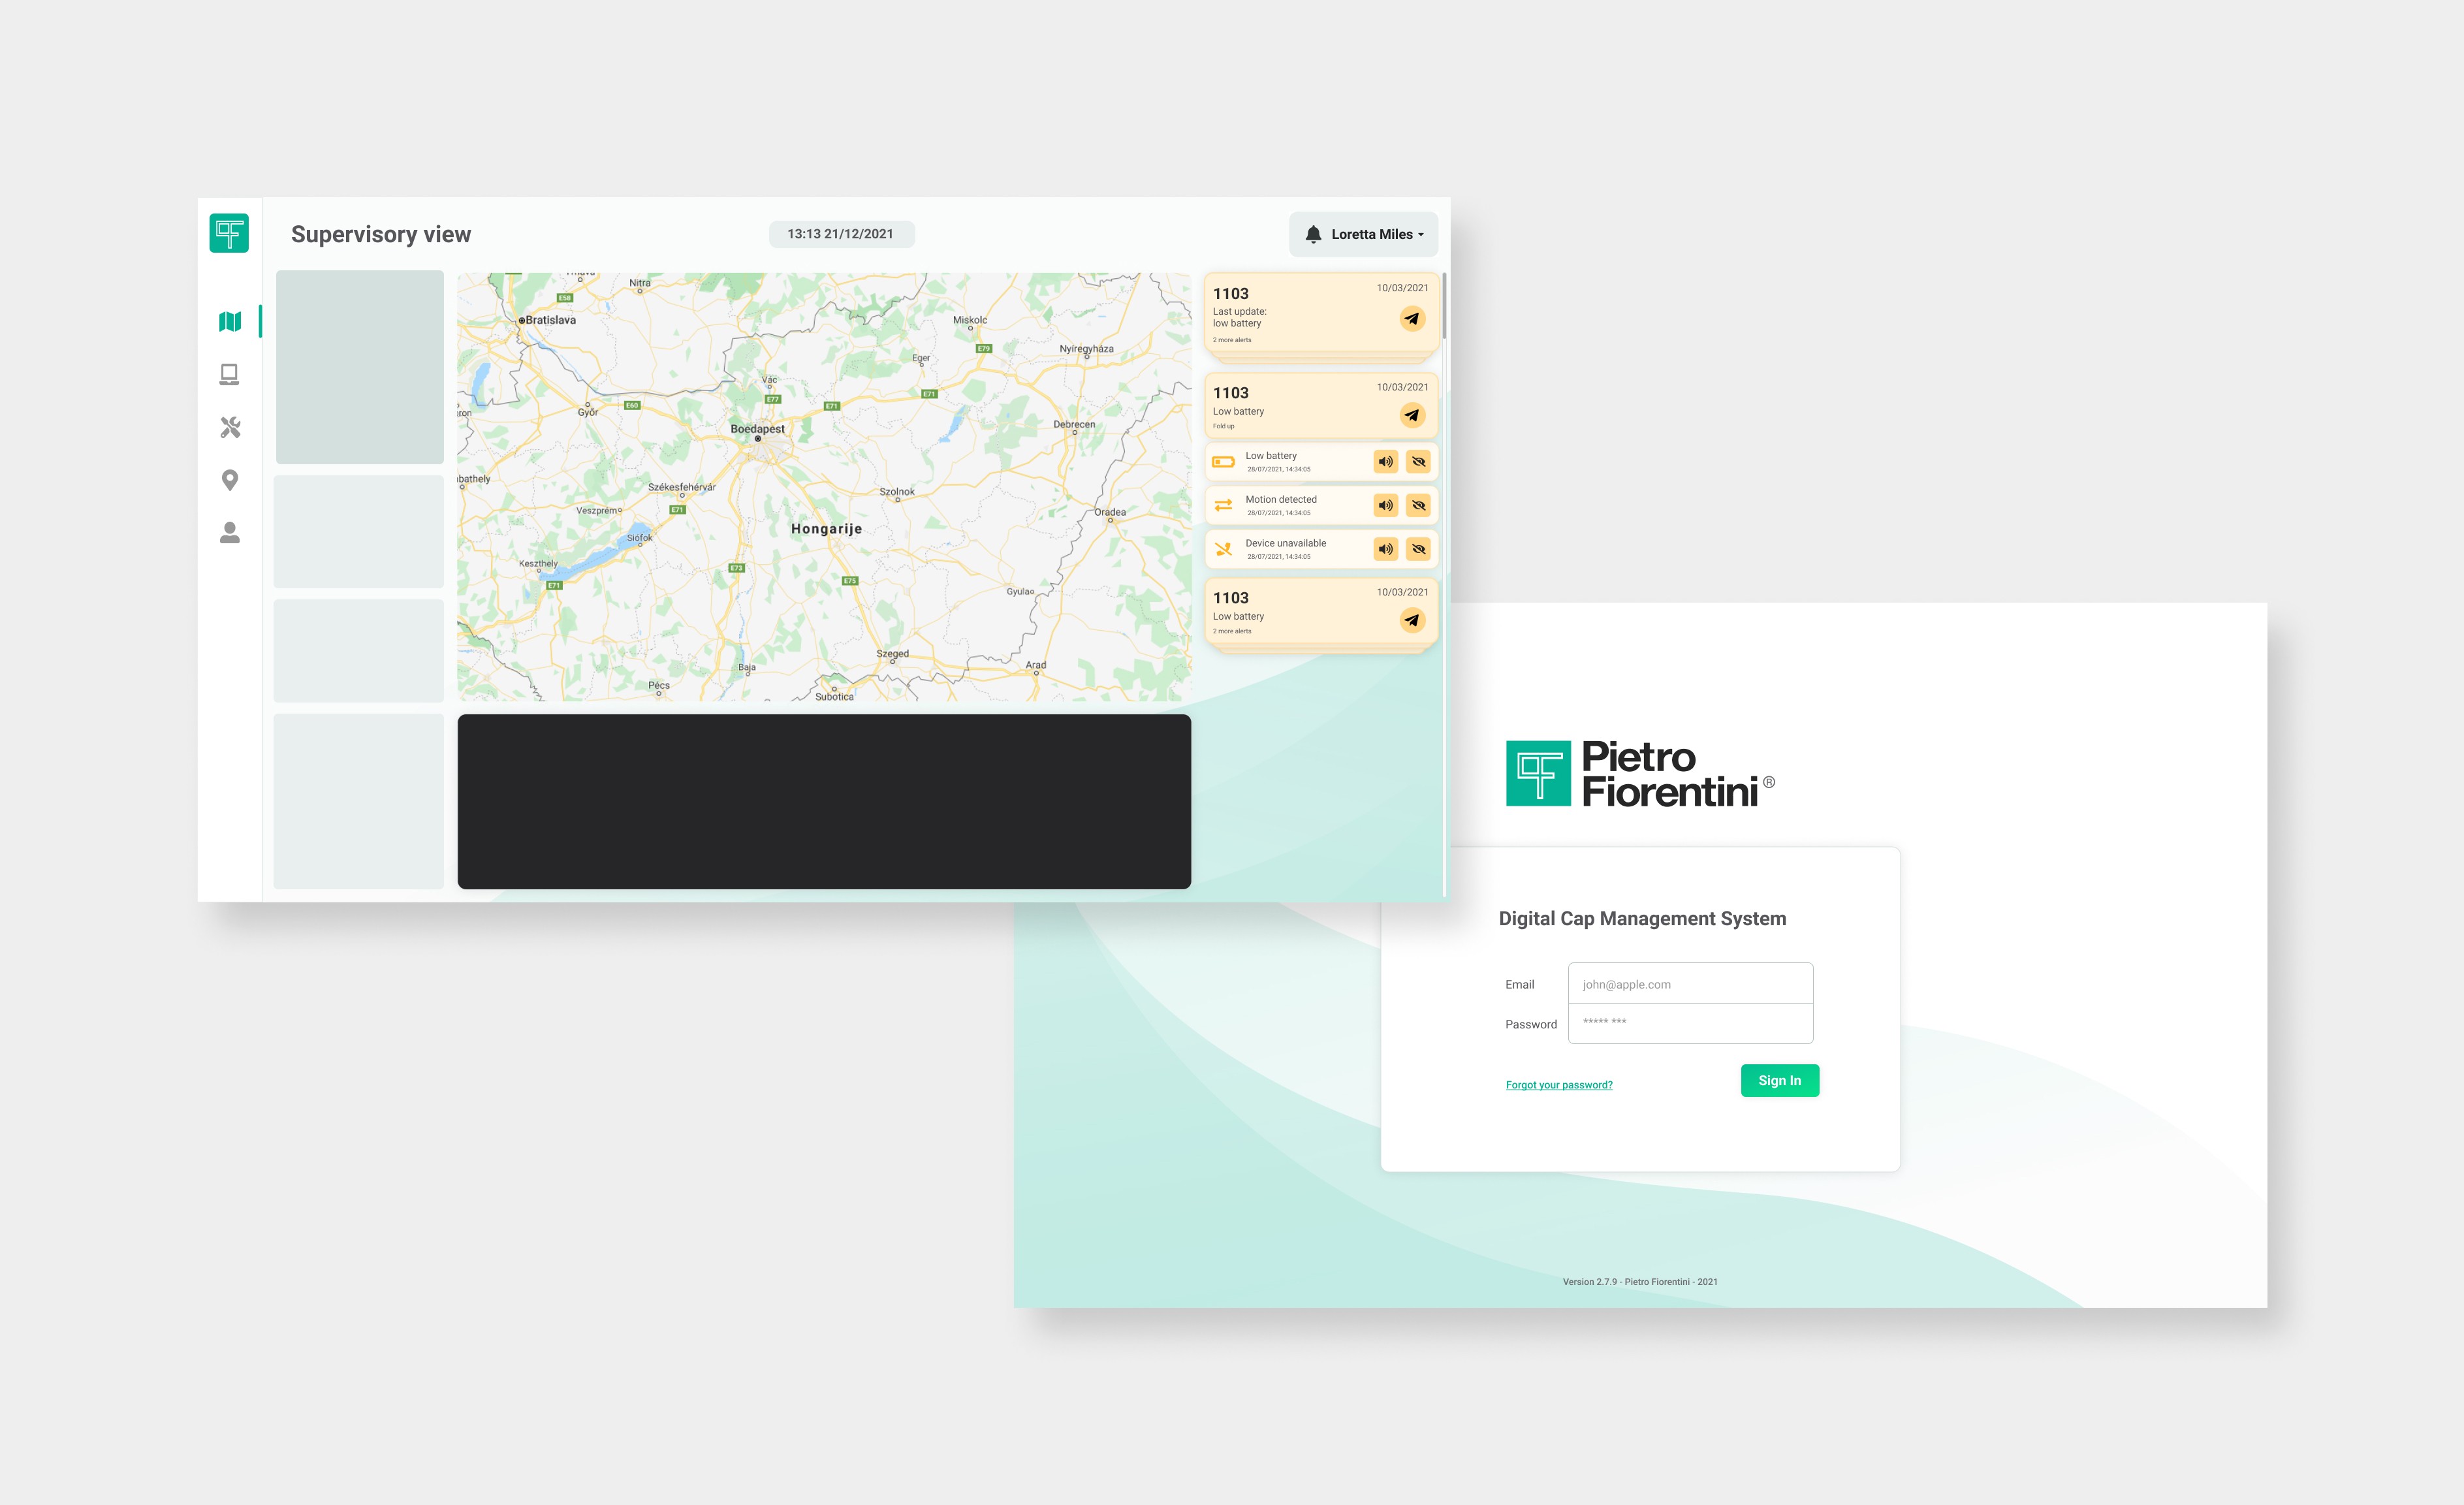
Operators faced significant challenges due to the absence of a coherent, centralized overview to manage and monitor the devices, which significantly hindered the operation and maintenance process. Operators monitoring the overall system lacked a clean dashboard view, and field technicians, dispatched for installation or troubleshooting, struggled with mobile access to set up the device or communicate with the operators.
GOAL
To design a versatile and responsive interface, that integrates with both desktop and mobile devices, providing a comprehensive overview for operators at a central monitoring station, while also being easily accessible and informative for technicians in the field.
IMPACT
The redesigned interface enhanced efficiency, resulting in quicker response times, improved service quality, and increased satisfaction among both technicians and end users.
APPROACH
STEP 1: RESEARCH & ANALYSYS
I conducted research to understand both the technical and user aspects of smart gas metering devices and their platform. This involved analyzing current user interfaces, identifying pain points through user feedback(both from the operators and technicians), and studying best practices on the market & with competitors. I closely collaborated with developers to gain insights into functional requirements and limitations of the system.
STEP 2: IDEATION & TESTING
Based on the insights I gained, I moved to the ideation phase. I sketched out multiple design concepts in Figma, and narrowed them down to a few solutions I could submit for testing. Each iteration was tested with both operators and field technicians to validate if it solved the problem or whether we needed to further explore our options. Feedback from these sessions was crucial and ensured cross-platform compatibility and ease of use in diverse environments.
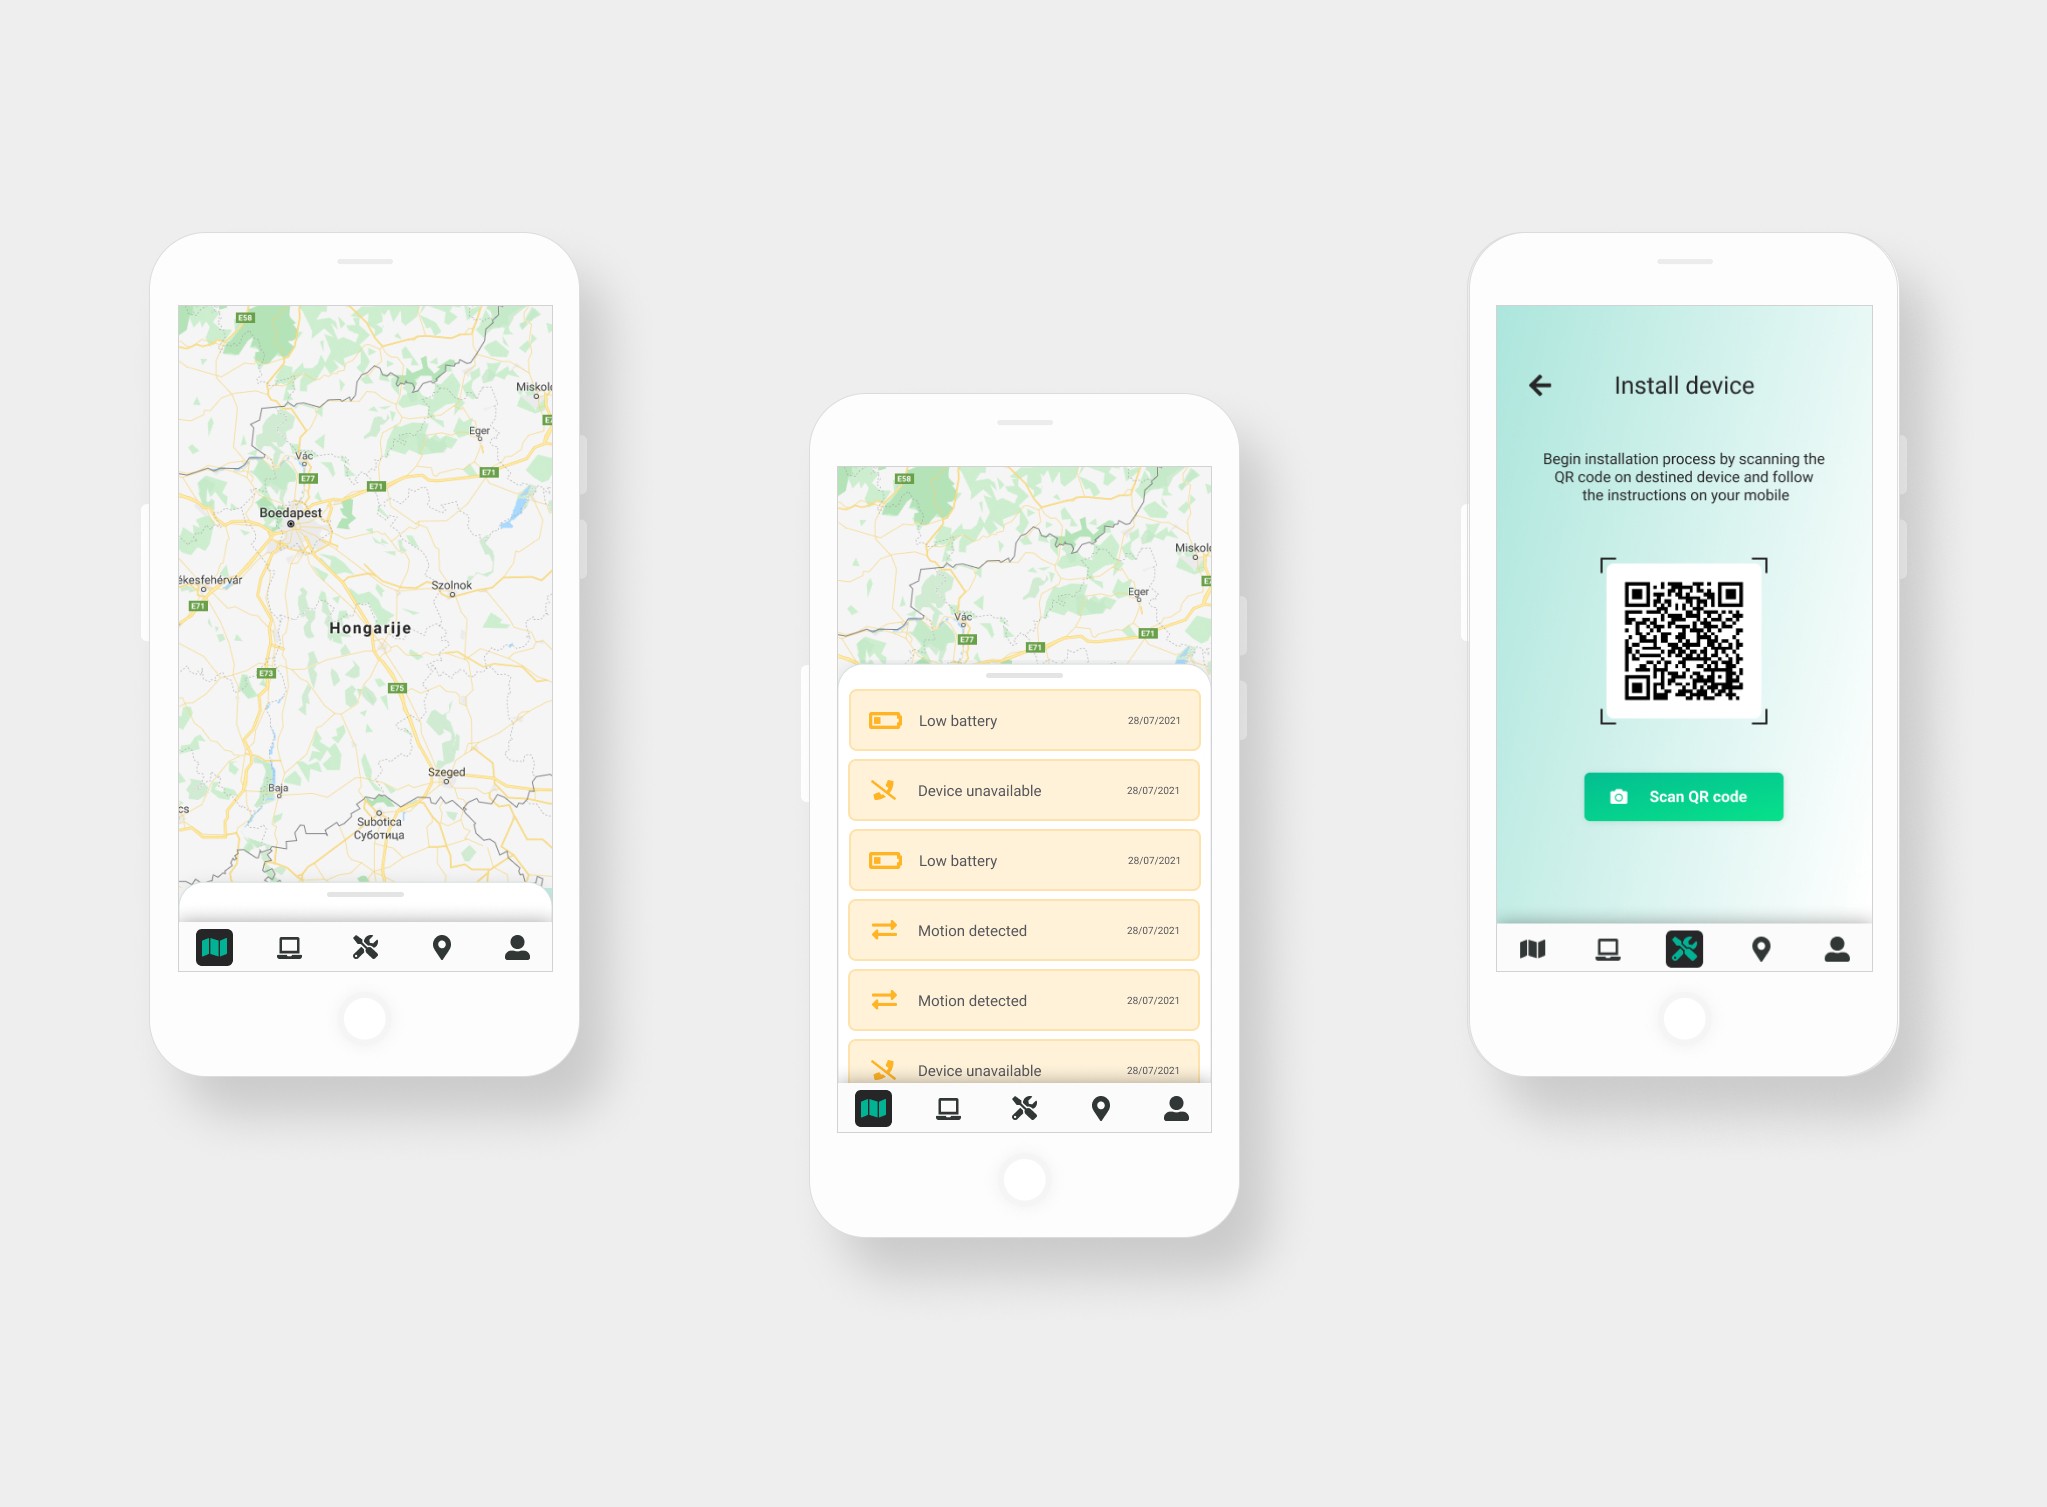
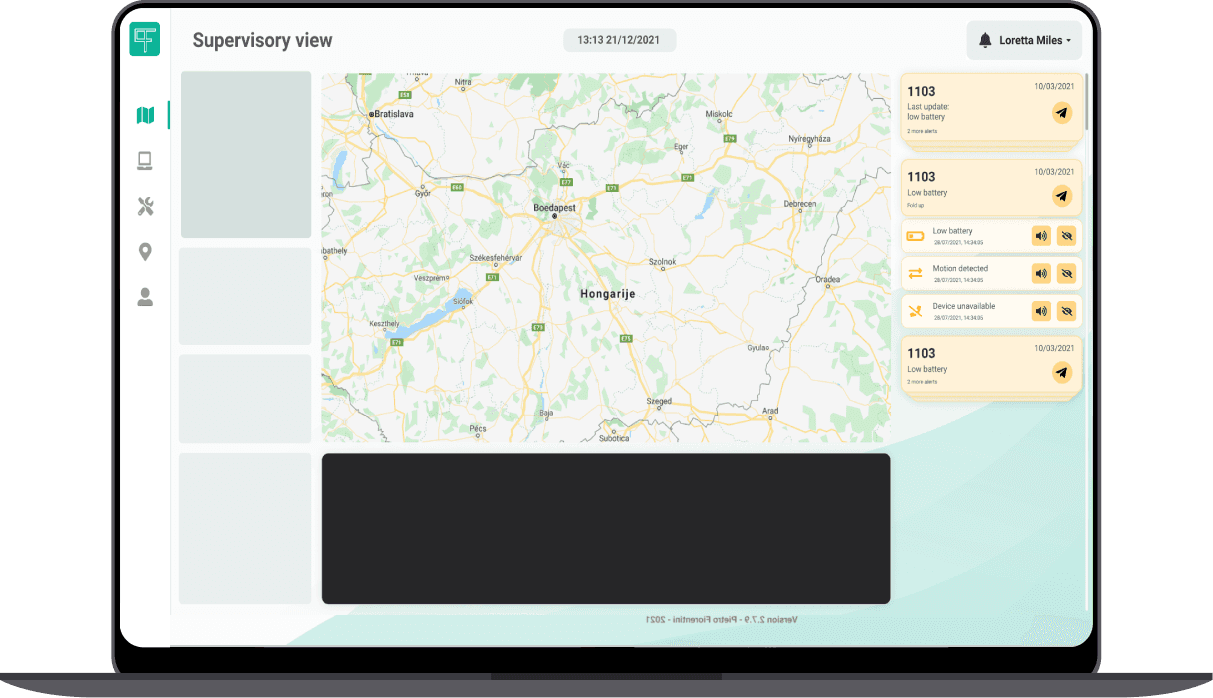
STEP 3: FINAL RESULT
The final design outcome resulted in a responsive, user-centric interface that improved the overall service quality. The desktop version provided a clear dashboard with an easy-to-navigate controls for central operators, and a straightforward mobile version for field technicians, with a quick access to essential information on the go. The design successfully bridged the gap between operational efficiency and user experience.